COVID-19 has changed the way world works and Live Video is now essential to maintaining enterprise communications. But how do you know if your videos are reaching the right people – and what the quality of the experience is for the viewer?
The answer to those questions and more can be found in your Live Video analytics dashboard. Here are six metrics you need to know to analyze Live Video performance.
Reach Score
The first metric you need to know is reach score. It is determined by summing the number of unique views with the number of anonymous viewing sessions. An anonymous viewing session is a view that cannot be determined, like if a viewing machine does not properly report play by a Globally Unique Identifier (GUID).
As opposed to solely reporting on unique viewers, reach score gives better insight into the total number of individuals reached by a Live Video. You can use this metric to evaluate the performance of your pre-event promotions: How many people showed up relative to the number invited? How does this compare to previous events you’ve hosted?
From there, you can draw parallels between lead time, invitation format, and even the business segments invited.
Average View Duration
Analyzing average view duration is the quickest and easiest way to tell if the content of your Live Event was engaging when compared to a baseline measure. By viewing aggregate data in the event summary dashboard, you can get a general idea how your audience typically behaves. Do they stay online for the entirety of a Live Event? Or do they drop off at the end of a session when the Q&A portion typically starts? Once you have a good understanding of this, you can compare it to the most recent event data to determine engagement.
Quality of Experience (QoE) Score
Nothing can derail a user’s experience quicker than buffering. Unfortunately for many enterprises, it’s an all-too-often occurrence when streaming Live Video to remote offices and worksites. Thankfully, QoE score gives organizers Insight into how end users experience their Live Events.
At Kollective, our QoE score is based on the time spent displaying video relative to the total time spent both displaying video and buffering – buffering in this case includes buffering before video startup and during playback. Here’s how it’s calculated:
The total time a user spends expecting to watch a video is described as:
TTotal = TBuffering + TPlaying + TStalled
Therefore, the QoE score would be equated such that:
QoE = (TPlaying / TTotal) * 100
The “good” threshold for QoE score is 90% or greater, while a “bad” QoE score is less than or equal to 70%.
A buffering video not only impacts view-ability and employee engagement. It can mean there are serious bottlenecks in your network that may be affecting business application performance. For businesses with Live Video QoE scores that fail to meet users’ expectations, an Enterprise Content Delivery Network (ECDN) can help alleviate the pressure on your network. Live video is a notoriously bandwidth heavy medium, and as the demand for it grows, you need to know that your network can reliably scale content to reach all employees.
Économies de bande passante
Once you’ve implemented an ECDN, it’s easy to monitor how much bandwidth it saves during each Live Event. Bandwidth savings is defined as percentage of bytes delivered via peering. Network administrators can reference this metric to determine ECDN effectiveness and network capacity.
Consommation géographique
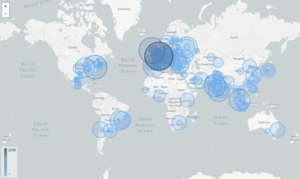 Now that you know how many people attended your event, what their experience was, and how much bandwidth you saved using an ECDN, it’s time to investigate where you content is being consumed. Kollective’s GeoExplorer allows you to drill down into how much content was consumed by how many users, even if there was a lag or buffering that occurred during event delivery.
This gives global enterprises the opportunity to see how messaging is received across the organization. Identify your top performing offices and those that need additional attention.
Efficacité du peering
Kollective’s ECDN leverages browser-based peering to deliver Live Video. Rather than relying on a single distribution point, it uses WebRTC Technology to enable direct peer-to-peer communication for all network-connected devices in a modern workplace. Peering efficiency is the normalized percentage of bytes delivered via peering. Or, in layman’s terms, how efficiently these connected devices transmit Live Video.
Learn More About What Great Analytics Reveal
Want to learn more about what great analytics reveal about Live Events? Join us for a webinar where we’ll teach you the ins and outs of Live Video reporting for Microsoft Teams.